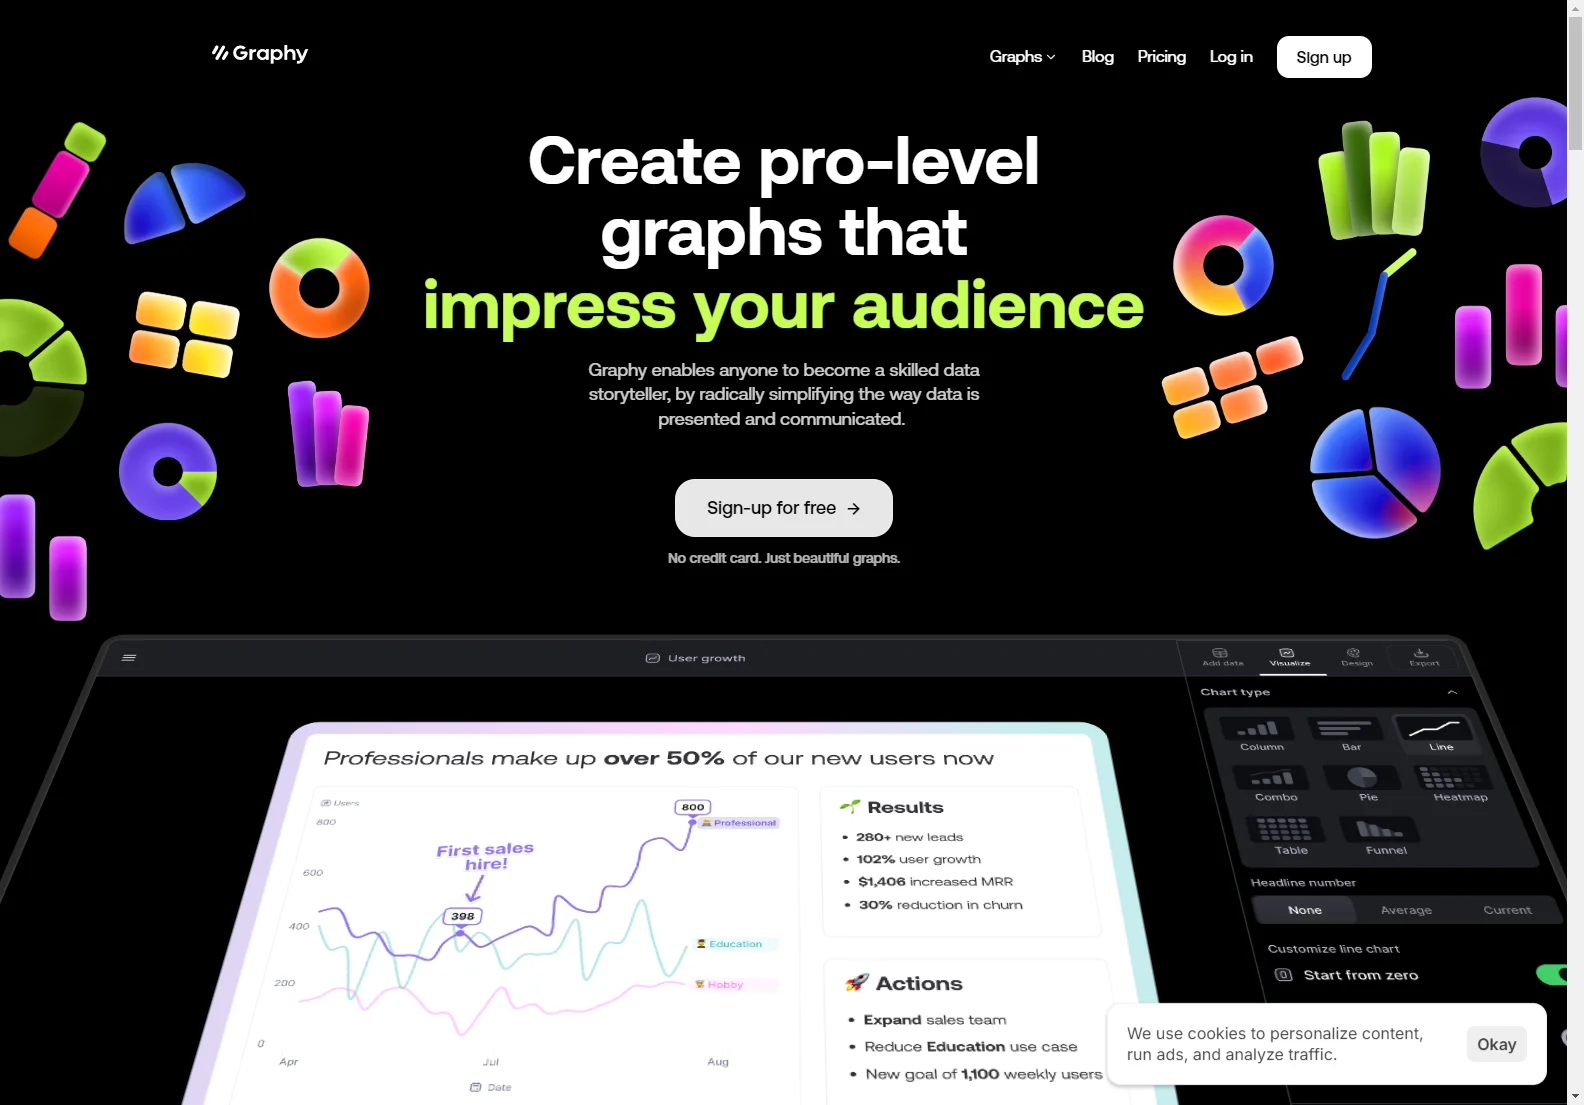
Graphy: Create Pro-Level Graphs That Drive Decisions
Graphy radically simplifies data presentation and communication, empowering anyone to become a skilled data storyteller. Say goodbye to confusing graphs and needless meetings—Graphy delivers actionable insights, faster decisions, and a delightful user experience.
Key Features
- AI-Powered Insights: Upload your data, and Graphy's AI will generate charts and explain key findings, ready for presentations or Slack.
- Lightning Fast: 80% faster than other visualization tools.
- Intuitive Interface: Easy to use, with powerful features and no learning curve.
- Stunning Results: Create interactive graphs you'll be proud to share.
- Rich Storytelling: Communicate insights effectively with visual annotations, goals, and trend lines.
- Seamless Integrations: Connect with Google Sheets and share graphs across various platforms (Slack, Notion, Canva, etc.).
Benefits
- Actionable Insights: Eliminate ambiguity and get straight to the key takeaways.
- Faster Decisions: Reduce meeting times and back-and-forth communication.
- Improved Collaboration: Share graphs easily and collaborate effectively with your team.
- Enhanced Communication: Present data clearly and persuasively.
Comparisons
Graphy distinguishes itself from other data visualization tools through its AI-powered insights, speed, ease of use, and focus on creating visually appealing and easily shareable graphs. Unlike tools that require extensive training or technical expertise, Graphy is designed for everyone, regardless of their data visualization skills.
Compared to creating charts in spreadsheets like Google Sheets or Excel, Graphy offers a significantly faster and more intuitive workflow. The AI assistance sets it apart, automating much of the process and providing clear interpretations of the data.
Use Cases
Graphy is suitable for various teams and use cases, including:
- Marketing: Analyze campaign performance, track key metrics, and present results clearly.
- Product Development: Visualize user data, identify trends, and make data-driven decisions.
- Sales: Track sales performance, identify top-performing products, and forecast future sales.
- Finance: Analyze financial data, create reports, and present findings to stakeholders.
Pricing
Graphy offers a free plan with limited features and a paid plan for more advanced functionalities and increased usage limits. Visit the Graphy website for detailed pricing information.
Conclusion
Graphy is a powerful and user-friendly data visualization tool that helps teams communicate data effectively and make data-driven decisions. Its AI-powered features, speed, and intuitive interface make it a valuable asset for any organization.

